
Both discretionary and systematic traders widely adopt technical analysis to make informed decisions in the financial market because of the Versatility of MACD in Technical Analysis. They commonly use the MACD (Moving Average Convergence Divergence) tool, which offers a comprehensive market trend overview. This article explores the pivotal role of MACD in technical analysis, examining different usage techniques and assessing parameter stability
MACD: A Key Indicator and the Versatility of MACD in Technical Analysis
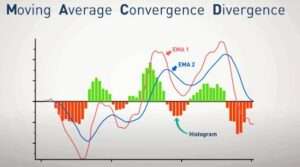
The acronym MACD, short for “Moving Average Convergence Divergence,” represents one of the most recognized indicators in technical analysis. It straightforwardly calculates the difference between two exponential moving averages: a faster one (typically with a shorter period) and a slower one (with a longer period). Additionally, it overlays a Signal Line, which is another exponential moving average calculated with a slightly shorter period. The histogram, also included in the indicator, portrays the values of the difference between the Signal Line and the MACD line, oscillating around the zero value
Using MACD and the Versatility of MACD in Technical Analysis
Multiple methods exist for using MACD, but one of the most famous involves the crossover of the Signal Line with the MACD or the histogram. According to this theory, when the Signal Line crosses above the MACD line, it generates a buy signal, and conversely, a cross below signals a sell. This method assumes that traders can effectively identify the uptrend or downtrend phases by analyzing these moving averages and their behavior over time.
Test Results on MACD
Tests evaluated the effectiveness of MACD on a basket of financial instruments over a specific period. However, the results from using the MACD crossover with the Signal Line on daily data produced mixed and unsatisfactory outcomes in terms of profitability. The return stayed close to zero, and significant drawdowns persisted.
It’s important to note that this strategy largely omitted exiting the market, lacked additional filters that could have enhanced results, and encompassed various financial instruments with weak correlations
Optimization of the Signal Line
For academic purposes, results were examined by varying the periods of the Signal Line. By reducing the periods, better results were obtained, although the drawdown remained significant, especially in recent periods. The return improved significantly compared to the traditional approach.
Introduction of Stops and Targets
In an additional attempt to enhance the system, stop-loss and take-profit levels were introduced. These changes led to significant improvements in the equity curve of the strategy. This version of the strategy proved to be more efficient than its original form.
In conclusion, MACD proves to be a flexible and potentially useful tool in technical analysis. This indicator can be adapted and improved to generate more reliable trading signals, as demonstrated by the conducted tests. We hope these insights can contribute to the further development of your trading strategies.