
HOW TO BUY AND USE
GVM PORTFOLIO DETAILS
GVM January 2024 Result
GVM OVERVIEW
GVM is our cutting-edge trading strategy that marries the power of growth, value, and momentum investing to unlock unparalleled potential in your portfolio. Our innovative approach carefully selects companies that not only exhibit strong growth prospects but also possess solid underlying value, all while harnessing the driving force of momentum to maximize returns.
This innovative approach has delivered exceptional results, boasting a 5 years track record of an average annual return of 27.66%, far surpassing the S&P 500’s 15.38%.
With this dynamic strategy, we bring you a uniquely balanced and diversified portfolio that captures the best of all worlds, promising a pathway to exceptional market performance.
GVM: AVERAGE ANNUAL RETURN
+27.66%
S&P 500: AVERAGE ANNUAL RETURN
+15.38%
GVM Approach
This cutting-edge trading strategy combines three investment approaches: growth, value, and momentum investing. Let’s break down how you can implement this innovative strategy:
- Growth Investing: We identify companies with strong potential for future growth. This involves looking at factors such as revenue and earnings growth, innovative products or services, expanding market share, and other indicators of a company’s ability to increase its value over time.
- Value Investing: We search for companies that are currently undervalued compared to their intrinsic worth. We analyze fundamental metrics like price-to-earnings ratio (P/E), price-to-book ratio (P/B), and dividend yield. This approach seeks to find stocks trading at a discount, providing a margin of safety for investors.
- Momentum Investing: We leverage the power of market momentum by identifying stocks that have exhibited strong recent performance. This could involve analyzing price trends, trading volumes, and other technical indicators. Momentum investing assumes that assets that have performed well in the past will continue to do so in the short term.
GVM
Growth
Investing
Value
Investing
Momentum
Investing
GVM KEY FEATURES
Investor Profile
This strategy is tailor-made for investors with a moderate risk appetite who seek the allure of high returns but understand and accept a degree of market volatility that’s substantial yet well-managed.
It’s designed to strike that delicate balance, offering the potential for significant gains while keeping any associated risks within reasonable bounds.

Customized for investors with a moderate risk appetite.

Appeals to those desiring high returns

Requires understanding and acceptance of substantial yet well-managed market volatility.

Aims to strike a delicate balance between potential gains and reasonable risk bounds
Asset Allocation
At its core, this strategy is a dynamic and agile approach to investing, and its portfolio structure reflects just that.
Within this strategy, you’ll find a carefully curated collection of 5 stocks.
These aren’t just any stocks; they’re meticulously chosen based on a set of stringent criteria.
We believe in quality over quantity. Each of these stocks has undergone rigorous analysis to ensure they’re not just preserving, but actively creating value for you, the investor.
Now, what makes this strategy truly unique is its responsiveness. With a weekly turnover of approximately 33%, it’s designed to keep pace with the ever-shifting dynamics of the market. We aren’t just holding onto positions for the sake of it. We’re constantly evaluating and reevaluating, ensuring your capital is where it should be – actively working for you.
And perhaps the most crucial element of this strategy: it’s not about companies gobbling up your hard-earned cash. It’s about companies that are conscious stewards of your investment, focused on generating real value and sustainable growth.
In a world where markets can be unpredictable, our asset allocation strategy offers both reassurance and opportunity. It’s about staying nimble, making informed decisions, and ensuring your capital is positioned for maximum growth potential while managing risk.
Dynamic & Agile Investing: Core strategy is dynamic and agile
Curated 5-Stock Portfolio: Selected based on stringent criteria
Quality Over Quantity: Rigorous analysis for value creation
Responsive 33% Weekly Turnover: Adapts to market dynamics
Continuous Evaluation: Positions actively managed
Conscious Stewardship: Focus on real value and growth
Reassurance & Opportunity: Asset allocation for stability
Nimble Decision-Making: Informed choices for growth
Stocks Turnover
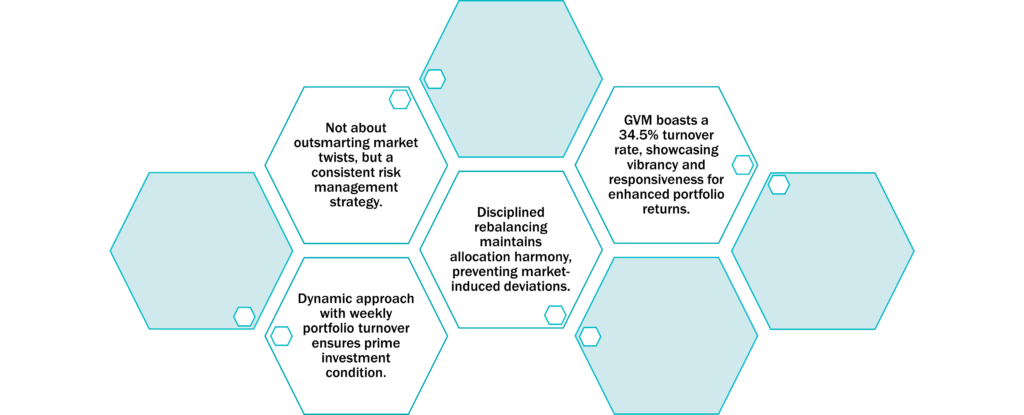
Our approach is not static but dynamic, with a weekly portfolio turnover that keeps your investments in prime condition.
Picture this: a disciplined rebalancing of your portfolio, an artful dance of assets to maintain the perfect harmony of allocation and risk. This process is not just a routine; it’s the lifeblood of our strategy. It’s the secret to ensuring your portfolio remains in sync with our overarching investment philosophy.
Why is this so crucial, you ask?
Because it prevents your portfolio from straying off course due to the whims of the market.
We’re not trying to outsmart the market’s unpredictable twists and turns; we’re focused on maintaining a steady hand on the investment tiller.
Our disciplined rebalancing isn’t about market timing; it’s about adhering to a consistent approach in managing investment risk and keeping your portfolio aligned with our strategy’s goals.
Over the past half-decade, GVM has boasted a 34.5% turnover rate. This statistic isn’t just a number; it’s a testament to our strategy’s vibrancy and responsiveness, all aimed at boosting your portfolio’s returns.
Risk Management
In the ever-changing landscape of financial markets, risk management is a vital element of any successful investment strategy. We’d like to shed light on how our GVM trading strategy incorporates robust risk management practices to provide you with a confident and secure investment experience.
At the heart of GVM’s risk management is the dynamic balance we maintain within the portfolio. This is the power of balance. We believe that to navigate the unpredictable waves of the market, one must be nimble yet resolute. To achieve this, GVM employs a unique combination of growth, value, and momentum criteria.
GVM’s risk management doesn’t end with stock selection. We maintain an unwavering vigilance, continuously assessing the portfolio’s alignment with our chosen parameters. This is Steadfast Vigilance. By monitoring these criteria closely, we ensure that our portfolio is in tune with the market’s momentum.
The dynamic nature of our approach allows us to adapt swiftly to market changes. We don’t chase market trends; instead, we align with them. This is adaptive resilience. It helps us manage risk effectively, minimizing exposure to potential downturns.
In summary, GVM is your strategic partner in the pursuit of balanced growth. Our risk management approach is designed to provide you with peace of mind in an ever-fluctuating market. We balance the pursuit of growth with the shield of value, ensuring your investments are on a steady course.
GVM ensures balanced growth, combining growth pursuit with the shield of value
Financial Landscape and Risk Management: GVM’s strategy prioritizes effective risk management for secure investments.
The Power of Balance in GVM’s Approach: GVM maintains a dynamic balance with a blend of growth, value, and momentum.
Steadfast Vigilance Beyond Stock Selection: GVM’s risk management includes continuous portfolio assessment for alignment.
AdaptiveResilience for Swift Market Changes: GVM adapts swiftly to market changes, minimizing exposure to downturns.
GVM STOCKS SELECTION CRITERIA
Let’s deep dive the selection criteria for GVM stocks. GVM distinguishes itself with 4 meticulously crafted parameters that we will see now one by one.
Criterion 1: Analyst Ratings
In Gvm we only select stocks with 100% strong buy rating.
When a stock has an Analysts’ Strong Buy rating of 100%, it means that all the analysts covering that particular stock have issued a recommendation that indicates a high level of confidence in its future performance. This circumstance can be very relevant for investors, and here’s why:
- Consensus Confidence: A unanimous Strong Buy rating from analysts suggests a consensus view that the stock is expected to outperform. It’s a signal that experts in the field have a high degree of confidence in the company’s prospects.
- Potential Upside: Strong Buy ratings typically imply that the stock is undervalued or has significant growth potential. Investors may interpret this as a signal that there is room for the stock price to appreciate in the future.
- Reduced Risk: While no investment is entirely risk-free, a unanimous Strong Buy rating can indicate that the company is well-positioned to weather challenges and is fundamentally sound. It may provide some level of comfort to investors concerned about risk.
- Information Gathering: Investors often consider analyst recommendations as part of their research process. A unanimous Strong Buy rating can prompt further investigation into the company’s financials, business model, and growth prospects.
This criteria give us a lot of confidence about the value and potential of the companies that we select, but, as everybody knows, the stock market can be unpredictable, and analysts can sometimes be wrong. This is why we never take decisions solely based on analyst recommendations.
GVM recognizes the unpredictable nature of the stock market and the potential for analyst errors.
Gvm’s stock selection process focuses exclusively on stocks with a 100% Strong Buy rating from analysts.
A unanimous Strong Buy rating signifies strong confidence from all analysts covering the stock.
This consensus confidence acts as a signal for anticipated outperformance, indicating potential upside and lower risk for investors.
The unanimous rating triggers additional research into the company’s financials and growth prospects.
Criterion 2: ROE
The second criteria is ROE over a concrete threshold.
Return on Equity (ROE) is a financial ratio that measures a company’s ability to generate profits from its shareholders’ equity. It is calculated by dividing net income by shareholders’ equity.
The formula for ROE is:
ROE=(Net Income/ Shareholders’ Equity)×100%
This parameter is very important for various reasons.
- Profitability Indicator: ROE is a key measure of profitability, indicating how efficiently a company is using the money invested by shareholders to generate earnings.
- Assessment of Management Efficiency: ROE is critical in assessing how well a company’s management is using its resources and investments to generate profits.
- Investment Attractiveness: Investors often use ROE to assess whether a company is a worthwhile investment. Higher ROE values generally appeal to investors looking for companies with strong profit-generating capabilities.
- Comparative Analysis: ROE helps compare the profitability of different companies within the same industry, providing insights into which companies are managing their equity more effectively.
It’s self evident that investing in companies with a higher Return on Equity (ROE) it is always a good idea, as you are putting your money on a company with a good financial performance and an efficient management.
Return on Equity (ROE) definition:
ROE is a financial ratio that measures a company’s ability to generate profits from its shareholders’ equity.
Calculation Formula:
ROE=(Net Income/ Shareholders’ Equity)×100%
ROE gauges efficiency in generating earnings from shareholder investments.
ROE assesses management efficiency in resource and investment utilization.
Higher ROE attracts investors seeking strong profit-generating capabilities.
ROE aids industry comparisons, revealing effective equity management.
Criterion 3: P/S Ratio
GVM 3rd CRITERIA is P/S Ratio below a certain threshold.
The P/S ratio, or Price-to-Sales ratio, is a financial metric used by investors to value a company based on its revenue. It is calculated by dividing the company’s market capitalization (or stock price per share) by its revenue (or sales) per share. The formula for the P/S ratio is:
P/S Ratio=Market Capitalization (or Stock Price per Share)/Revenue per Share
These are the main reasons of the importance of the P/S Ratio for Investors:
- The P/S ratio is primarily used as a valuation tool. It gives investors an idea of how much they are paying for each dollar of a company’s sales. A lower P/S ratio might indicate that the stock is undervalued, whereas a higher P/S ratio could suggest overvaluation.
- It is especially useful for valuing companies that are not yet profitable, which is common in certain sectors like technology or biotech. Since these companies might not have earnings, traditional metrics like the P/E (Price-to-Earnings) ratio can’t be applied. The P/S ratio provides a way to value these companies based on their sales.
- Investors use the P/S ratio to compare companies within the same industry. Different industries will have different average P/S ratios, so it’s important to compare companies in the same sector.
- Unlike earnings, which can be affected by various accounting practices and non-cash charges, sales figures are generally less subject to manipulation. Therefore, the P/S ratio can sometimes provide a clearer picture of a company’s core performance
- For growth companies, particularly those rapidly increasing their sales year over year, the P/S ratio can be a way to value their growth potential, even if that growth has not yet resulted in profit.
The P/S ratio is an invaluable component of the GVM strategy, particularly when used alongside the other metrics employed by this approach. This amalgamation of parameters facilitates a thorough analysis of the stocks within our portfolio. It assures a comprehensive assessment of each company’s financial stability, standing in the industry, and potential for future growth.
Price-to-Sales (P/S) Ratio Definition:
Financial metric used by investors to value a company based on its revenue
Calculation Formula:
P/S Ratio=Market Capitalization (or Stock Price per Share)/Revenue per Share
Valuation Metric
ROE assesses management efficiency in resource and investment utilization.
Non-Profitable Firms
ROE aids industry comparisons, revealing effective equity management.
Industry Comparisons
ROE aids industry comparisons, revealing effective equity management.
Transparent Performance
ROE aids industry comparisons, revealing effective equity management.
Growth Potential Indicator
ROE aids industry comparisons, revealing effective equity management.
Criterion 4: Price Of The Stock
The 4th criteria is the Price of the stock over a certain threshold.
The rationale behind selecting stocks with a price over a certain threshold can be crucial for the strategy’s implications for risk and return.
Price Thresholds in Stock Selection is relevant in considertion of 6 rationales:
- Stocks priced above a certain threshold often exhibit lower volatility compared to lower-priced stocks. High-priced stocks are typically associated with established companies that have more predictable business models and stable earnings, which can lead to less price fluctuation.
- Higher-priced stocks are often considered a proxy for quality. They can represent companies with strong fundamentals, such as solid earnings, robust growth prospects, and reliable management. Investing in such stocks can potentially lead to better long-term returns.
- Higher-priced stocks are more likely to attract institutional investors, such as mutual funds and pension funds, who generally conduct extensive research before investing. Their interest can be a positive signal regarding the stock’s quality and stability.
- By setting a price threshold, investors can avoid penny stocks, which are often highly speculative and risky. Penny stocks usually have low liquidity, limited company history, and are more susceptible to price manipulation.
- Stocks with higher prices generally have higher liquidity, meaning they can be bought or sold in the market with minimal impact on their price. This liquidity is crucial for investors who may need to adjust their portfolio quickly in response to changing market conditions.
- Companies with higher stock prices often have better corporate governance practices. Good governance can reduce risks related to mismanagement and unethical business practices, contributing to the long-term health and performance of the investment.
In summary, selecting stocks with a price above a certain threshold it’s another piece of a GVM: a strategy aimed at investing exclusively in stable, high-quality companies.
WHY
Selection of stocks above a certain threshold is driven by the need to manage risk and enhance returns in investment strategies.
WHAT
The strategy involves focusing on stocks with prices surpassing a specific threshold.
HOW
Criteria for selection include lower volatility, acting as a quality indicator, attracting institutional investor interest, avoiding penny stocks, considering liquidity, and assessing corporate governance.
Anticipated benefits encompass reduced volatility, potential for better long-term returns, positive signals from institutional interest, avoidance of speculative risks, liquidity advantages, and improved corporate governance leading to sustained investment health.
GVM PERFORMANCE
GVM Performance Year by Year
Today, we bring you a remarkable opportunity that has been rewriting the rules of investment. It’s time to consider a strategy that doesn’t just promise returns; it delivers them consistently.
Let’s dive right into the numbers because, in investing, that’s what truly matters.
Over the last five years, GVM has not only delivered impressive results, but it has done so with unmatched precision.
GVM 5 YEARS
+138.44%
S&P 500 5 YEARS
+76.99%
GVM Performance 5 years Average Return
Over the last 5 years, while the S&P 500, a benchmark for many, clocked in an annual average return of 15.38%, GVM soared ahead with an annual average return of 27.66%. That’s a substantial difference that can’t be ignored.
GVM 5 YEARS AVERAGE RETURN
+27.66%
S&P 500 5 YEARS AVERAGE RETURN
+15.38%
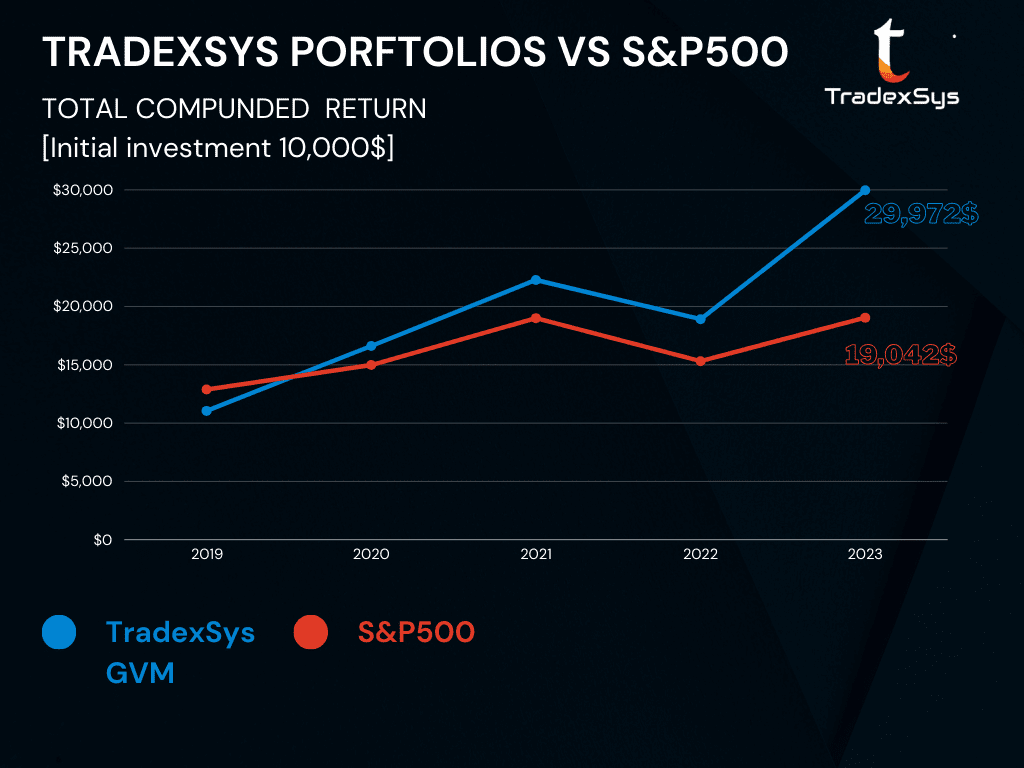
GVM Performance Total Compounded Return
Let’s consider Total Compounded Returns. GVM’s total compounded return since 2019 stands at a staggering 299.7%. Imagine this – if you had invested $10,000 in GVM on January 1st, 2019, today, you’d be sitting on $29,997. That’s nearly triple your initial investment. It’s about making your money work harder and smarter for you.
GVM TOTAL COMPOUNDED RETURN
+299.7%
S&P 500 TOTAL COMPOUNDED RETURN
+190.4%
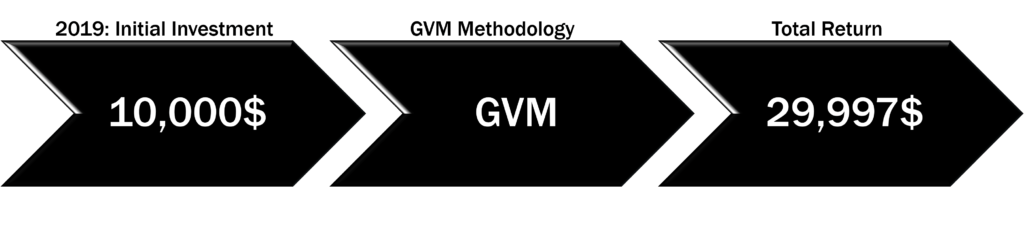
If you had invested 10.000$ in 2019 today, you would have 29,997$
GVM Performance Key Factors
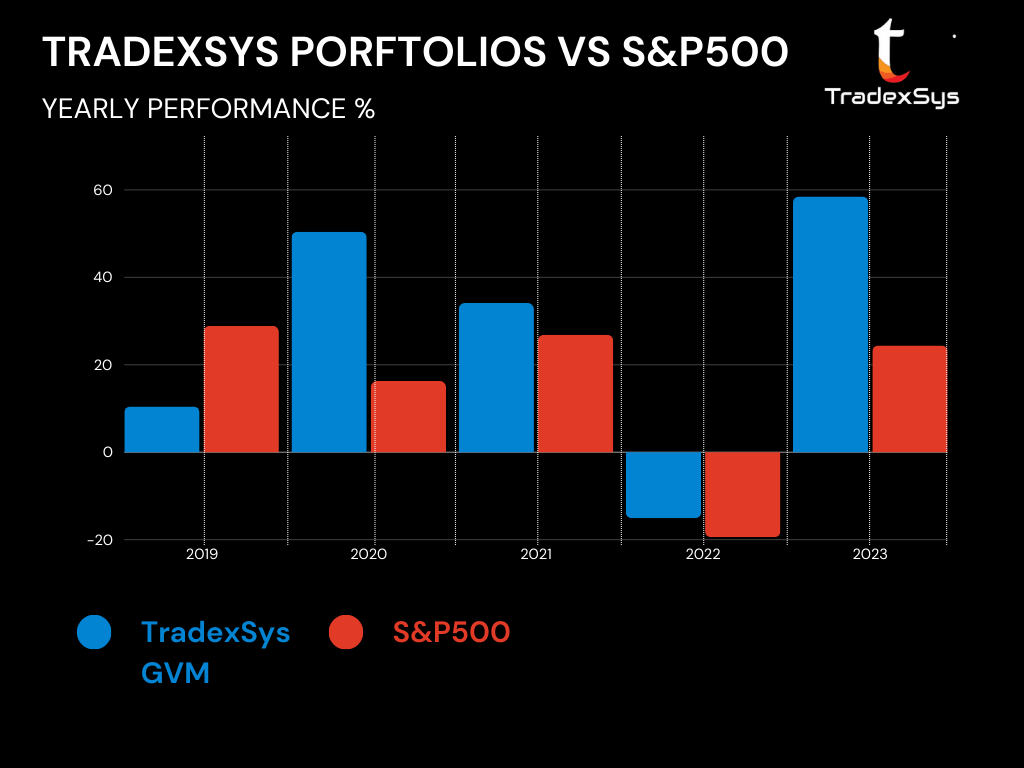
GVM has shown its mettle by outperforming the S&P 500 in four out of the last five years. This isn’t just about beating the index; it’s about creating wealth when others struggle.
GVM doesn’t just deliver good returns; it delivers outstanding ones. In two out of the last five years, GVM’s returns exceeded 50%, while it consistently surpassed 30% in three years. In comparison, the S&P 500’s best year in the last five was 2019, with a gain of 28.88%.
GVM overcame a 43.9% drawdown in early 2020, rebounding with a 50.4% return in 2020. In 2022, despite challenges, it outperformed the index by 4%.

Over the last decade, GVM beat the S&P 500 four out of five times.

In two out of the last five years, GVM’s returns exceeded 50%, while it consistently surpassed 30% in three years.

In 2020 and 2022 GVM showed also its ability to navigate through uncertainty, always outperforming S&P 500.
GVM Performance Resilience Amid Challenges
During the turbulent times of January to March 2020, as the world grappled with the Covid pandemic, GVM had a maximum drawdown of 43.9%. What’s truly remarkable is that GVM didn’t just recover; it thrived. In 2020, it achieved an astonishing 50.4% return, more than triple the S&P 500’s 16.26%.
In 2022, a year that challenged many, GVM remained steadfast, it closed negative but it outperformed the index by over 4%. This is a testament to GVM’s ability to navigate through uncertainty.
2020
Even if Max drawdown was higher compared to S&P500, GVM closed 2020 with a 50.4% return, more tnan tripling the S&P 500 in a singular year.
2022
GVM remained steadfast, it closed negative but it outperformed the index by over 4%.
Amid challenging market conditions, GVM rebounded impressively and showcased resilience, outperforming the S&P index.
GVM in Conclusion
In conclusion, GVM isn’t just another strategy; it’s a game-changer. It’s an opportunity to seize control of your financial future and witness returns that redefine what’s possible. We invite you to experience the amazing performance of GVM firsthand.
Try GVM for free and unlock your investment potential. Don’t miss out on the chance to transform your financial journey. Discover GVM today and step into a world of superior returns.
Financial game-changer with extraordinary returns. Try for free!
Unlock your investment potential with GVM’s amazing performance.
Transform your financial journey – discover GVM for superior returns.