
HOW TO BUY AND USE
CLAU PORTFOLIO DETAILS
CLAU January 2024 Result
CLAU OVERVIEW
CLAU is a strong example of profitable trading methodologies that has delivered extraordinary results.
CLAU is The Art of Selecting Gems: Our approach is unique. We don’t just pick stocks; we select gems within the financial universe. What makes these stocks special? They possess remarkable balance parameters of growth.
CLAU: AVERAGE ANNUAL RETURN
+43.73%
S&P 500: AVERAGE ANNUAL RETURN
+11.03%
CLAU Approach
Let’s delve into CLAU approach:
- A Strategic Blend of Metrics: Our strategy meticulously assesses metrics such as net margin, return on equity (ROE), return on investment (ROI), earnings per share (EPS). These parameters are the building blocks of our selections. They provide a strong foundation for growth and stability.
- A Portfolio of hidden treasuries: The companies in our portfolio aren’t just stocks; they are pearls. They’ve demonstrated their potential for growth and profitability, making them standout performers in the market. These companies are poised to outshine their peers.
- Consistency in Excellence: Our strategy isn’t a one-time wonder. It’s designed for consistent excellence. We don’t chase fleeting trends. Instead, we focus on enduring value and steady growth.
- Unleash Your Investment Potential: By joining our strategy, you’re not just investing; you’re unleashing your investment potential. You’re becoming a part of a select group of investors who understand the power of selecting the best stocks in the financial universe.
- The Path to Your Financial Goals: We believe that investing should be a path to achieving your financial goals, whether it’s building wealth, securing your future, or fulfilling your dreams. Our strategy is a compass that guides you towards these goals.
CLAU
Strategic Blend of Metric
Portfolio of Hidden Treasuries
Consistency in Excellence
Unleashed Investment Potential
Path to Financial Goals
CLAU KEY FEATURES
In a world where financial markets can be overwhelming and unpredictable, our strategy offers clarity and confidence. It’s about making informed choices that lead to remarkable results.
Investor Profile
The CLAU trading strategy is tailor-made for a specific type of investor, one who seeks substantial growth potential while maintaining a moderate level of risk. This strategy is ideally suited for:
- Investors who prioritize capital appreciation and are willing to accept a degree of risk to achieve substantial returns. These are the Growth-Oriented Investors. CLAU focuses on selecting stocks with significant growth potential.
- CLAU may appeal to investors who prefer a focused portfolio. Indeed, the strategy’s portfolio consists of a few selected stocks with the potential for exceptional growth. CLAU is based ona concentrated approach more than a diversified one .
- Investors who prioritize strong performance, the Performance-Driven Investors. CLAU’s historical returns and consistent outperformance against the benchmark make it an attractive choice.
- Those who remained invested even during market downturns, the Steadfast Investors. CLAU’s impressive performance during challenging periods, such as the COVID-19 pandemic, or the financial crisis of 2022, highlights its resilience.
In summary, the CLAU trading strategy caters to growth-oriented investors who seek to capitalize on exceptional growth potential within a moderate risk framework. It’s designed for those who believe in the power of strategic stock selection and are looking for a compelling opportunity to achieve impressive returns over the long term.
Tailor-made for a specific type of investors who seek substantial growth potential while maintaining a moderate level of risk
Growth-Oriented Investors
Diversified Portfolio Seekers
Performance-Driven Investors
Steadfast Investors
Asset Allocation
At the heart of the CLAU trading strategy lies a meticulously crafted asset allocation approach. We’ve designed this strategy with a singular focus. It provides investors with the opportunity to harness the extraordinary growth potential of a select few companies while maintaining a balanced and sustainable path.
CLAU’s portfolio is a Focused Portfolio. CLAU’s portfolio is thoughtfully composed of just three carefully chosen stocks. This focused approach allows us to channel our resources and expertise into companies that truly stand out in terms of growth indicators.
Our stock selection is a Growth-Centric one. The selection process places paramount importance on key growth indicators, including net margin, return on equity (ROE), return on investment (ROI), and earnings per share (EPS). However, it’s not merely about selecting companies with the highest numbers; rather, we look for companies that exhibit growth potential within a specific, sustainable threshold.
Moreover, by adhering to this approach, CLAU strikes a unique balance between identifying companies with immense growth potential and ensuring they have a sustainable trajectory for that growth. CLAU combines Balances Potential with Sustainability. We believe in combining the financial health and stability of our chosen companies with their capacity for exceptional growth.
This asset allocation strategy is designed to offer investors a rare opportunity – the ability to invest in companies that are poised for remarkable growth while minimizing the risks associated with high volatility or unsustainable growth models.
At CLAU, we don’t chase after fleeting trends or speculative investments. Instead, we focus on building a portfolio that stands the test of time and empowers our investors to participate in the exciting journey of companies with promising growth prospects. Our approach to asset allocation is a testament to our commitment to achieving both financial performance and sustainability.
CLAU TRADING STRATEGY
- Meticulously Crafted Asset Allocation Approach
- Singular Focus on Extraordinary Growth Potential with Balance
CLAU’s PHILOSOPHYY
- No Chasing Trends or Speculative Investments
- Focus on Building a Time-Tested Portfolio for Long-Term Growth
Commitment to Performance and Sustainability:
- Testament to Achieving Financial Performance and Sustainability
- Empowering Investors in the Exciting Journey of Promising Growth Companies
Focused Portfolio:
- Testament to Achieving Financial Performance and Sustainability
- Empowering Investors in the Exciting Journey of Promising Growth Companies
Growth-Centric Selection:
- Key Indicators: Net Margin, ROE, ROI, EPS
- Emphasis on Sustainable Growth within Specific Thresholds
Balancing Potential with Sustainability:
- Striking a Unique Balance for Sustainable Growth
- Combining Financial Health and Stability with Growth Capacity
INVESTMENT OPPORTUNITY
- Rare Opportunity for Remarkable Growth
- Minimizing Risks Associated with Volatility and Unsustainable Models
Stocks Turnover
A key aspect, that sets our CLAU strategy apart and contributes to its outstanding performance, is its dynamic turnover.
In the world of trading, where markets can change in the blink of an eye, staying agile is paramount. CLAU adheres to a disciplined weekly portfolio turnover, ensuring that our investments are always aligned with our strategic parameters. This regular review process is not just about reacting to market shifts; it’s about proactively seizing opportunities for growth.
Over the past three years, CLAU has maintained an average turnover rate of 40%. This impressive figure signifies a strategy that’s alive and responsive, actively seeking to enhance overall portfolio returns. By constantly reassessing our holdings, we ensure that our portfolio consists of companies with the precise growth parameters we desire.
However, our turnover isn’t solely about adapting to market changes; it’s also a reflection of our commitment to maintaining a positive market sentiment over the stocks in our portfolio. By routinely refreshing our investments, we demonstrate our dedication to maximizing growth while mitigating risks.
In the ever-evolving landscape of finance, a proactive approach is essential. With CLAU, you can be confident that your investments are in a strategy that’s always ready to capitalize on opportunities and navigate market fluctuations.

CLAU Strategy Dynamics
Sets apart with outstanding performance.
Adheres to disciplined weekly portfolio turnover.
Proactively seizes growth opportunities.
Essential in the fast-paced trading environment.

Impressive 40% Average Turnover
Demonstrates agility and responsiveness.
Actively enhances overall portfolio returns.
Constant reassessment ensures precise growth parameters.
Reflects commitment to positive market sentiment.

Proactive Growth and Risk Mitigation
Constantly refreshes investments.
Dedicated to maximizing growth.
Mitigates risks in an ever-evolving financial landscape.
Confidence in CLAU’s readiness to capitalize on opportunities and navigate market fluctuations
Risk Management
CLAU’s Approach to Investment embraces Risk for Remarkable Returns.
We want to be candid with you. Our CLAU strategy is not for the faint of heart or the risk-averse. If you’re seeking safe and conservative investments, this might not be the right choice. But if you’re ready to embrace the challenge and reap the rewards, then listen closely because CLAU has a story to tell.
At its core, CLAU is a high-risk strategy. It’s designed for those who are bold, those who are unafraid of market volatility, and those who understand that the path to exceptional returns is often paved with ups and downs. We believe that to achieve great returns, you can’t be timid when the market fluctuates. As investors, we must have the courage of our convictions.
What sets CLAU apart is its ability to weather these storms while still delivering impressive results. Yes, you might see periodic drawdowns, but remember this: in every moment, you have remarkable companies in your portfolio. These companies have been meticulously selected based on rigorous criteria. Their growth potential is enormous, and they are the gems within the vast universe of financial markets.
Let’s talk about those drawdowns for a moment. They might seem daunting at times, but at the end of the day, they’re just part of the journey. As you navigate these ups and downs, remember the words of Warren Buffett: “Be greedy when others are fearful.” It’s during these fearful moments that you have the opportunity to position yourself for extraordinary gains.
Our strategy is not about avoiding risk; it’s about managing it intelligently. It’s about balancing the thrill of high returns with the reality of market fluctuations. And when you look at CLAU’s performance, you’ll see that this approach pays off.
In the end, it’s your courage and discipline that will be richly rewarded. We invite you to join us on this exciting journey with CLAU, where risk meets reward, and where remarkable returns are waiting for those who dare to seize them.
CLAU’s investment strategy emphasizes embracing risk for potentially remarkable returns
Tailored for bold investors comfortable with market volatility
Core Philosophy
- High-risk approach requires courage and tolerance for market fluctuations.
- Exceptional returns come from navigating market ups and downs.
Differentiating Factors
- CLAU stands out for weathering market storms while delivering impressive results.
- Portfolio comprises meticulously selected, high-potential companies.
Strategy focuses on intelligently managing, risk. Investors invited to join an exciting journey where risk meets reward, emphasizing courage and discipline for rich rewards.
CLAU STOCKS SELECTION CRITERIA
CLAU distinguishes itself with six meticulously crafted parameters. Let’s see together one by one
Criterion 1: Analyst Ratings
We focus on companies with an average analyst rating of 2 or lower, indicating strong buying potential. When a stock has an average analyst rating of “Buy” or “Strong Buy,” it reflects the consensus opinion of financial analysts covering that particular stock. Analysts from various financial institutions and research firms provide ratings on stocks based on their research and analysis.
The average rating is calculated by combining these individual ratings and determining the overall consensus. If most analysts give a stock a “Buy” or “Strong Buy” rating, the average rating reflects this positive sentiment. Analysts spend considerable time researching companies, including their financials, industry position, market trends, and future prospects. Their ratings are based on in-depth knowledge and analysis, therefore these ratings can serve as a useful guide in making investment decisions. Analyst ratings can influence market sentiment and investor behavior. A “Buy” or “Strong Buy” rating may attract more investors to the stock, potentially driving up its price. In conclusion, the Analysts Rating parameter is a very valuable tools for our strategy, because it ensures a positive outlook of the company by the experts covering the stock.
Strategic Focus
- Prioritize companies with an average analyst rating of 2 or lower for strong buying potential.
- “Buy” or “Strong Buy” ratings reflect positive consensus from analysts based on comprehensive research.
+
Market Influence
- Average rating, calculated from individual analyst opinions, impacts investor behavior and market sentiment.
- Positive ratings can attract more investors, potentially driving up the stock’s value.
Criterion 2: Net Margin
The Net Margin of a company is a financial metric that represents the percentage of a company’s revenue that is left as profit after all expenses, taxes, and interest payments have been deducted. Essentially, it tells you how much profit a company makes for each dollar of sales it generates. Net Margin is a crucial indicator of a company’s financial health and efficiency.
The formula to Calculate Net Margin is:
Net Margin=(Net Income/Total Revenue)×100%
Where:
- Net Income is the profit after all operating expenses, interest, taxes, and other expenses have been deducted from total revenue.
- Total Revenue is the total income earned from sales of goods or services.
Incorporating the Net Margin as a key criterion in a trading strategy can be a wise decision for several reasons, especially when the goal is to select stocks of companies that are financially robust and efficient. Here’s why focusing on companies with higher Net Margins is beneficial for Clau:
- The Net Margin is an Indicator of Financial Health and Efficiency:
- A higher Net Margin indicates that a company is proficient at converting sales into profits. This is a sign of strong financial health, suggesting the company manages its costs effectively and has solid pricing strategies.
- Companies with high Net Margins usually have better control over their operating expenses and are efficient in managing their resources, which can be critical during economic downturns or competitive pressures.
- The Net Margin is an indicator of Sustainable Performance:
- Companies with consistently high Net Margins are often seen as having sustainable business models. This sustainability can make them more reliable investments over the long term.
- Attractiveness to Investors:
- High Net Margin is often a signal to investors that the company has a competitive edge in the market. It can attract more investment, potentially driving the stock price up.
- Companies with higher profits relative to their revenues are often in a better position to pay dividends, making them attractive to income-focused investors.
- Risk Mitigation:
- Companies with higher Net Margins may have more cushion to absorb economic shocks, making their stocks potentially less risky during market downturns.
- Comparative Advantage:
- High Net Margin can be a competitive advantage in the industry. It indicates that the company is performing better than its peers in terms of profitability, which can be a key factor in stock performance.
- Growth Prospects:
- Companies with more profits have more opportunities to reinvest in their business, fund new initiatives, or enter new markets, driving future growth.
Net Margin Definition:
Net Margin is the percentage of a company’s revenue remaining as profit after deducting all expenses
Calculation Formula:
Net Margin = (Net Income/Total Revenue) × 100%
Financial Health Indicator: Measures sales-to-profit efficiency, signaling strong financial health.
Investment Strategy Rationale: Prioritizing high Net Margins in stock selection is crucial
Investor Benefits: Instills confidence, indicates dividends, attracts investments
Risk Mitigation and Comparative Advantage: High Net Margins protect in downturns, offer a competitive edge
Growth Prospects and Conclusion: Indicates reinvestment potential, crucial for less risky strategies
Criterion 3: Return on Equity (ROE)
Return on Equity (ROE) is a financial ratio that measures a company’s ability to generate profits from its shareholders’ equity. It is calculated by dividing net income by shareholders’ equity. The formula for ROE is:
ROE=(Net Income/ Shareholders’ Equity)×100%
Where:
- Net Income is the profit after all operating expenses, interest, taxes, and other expenses have been deducted from total revenue.
- Share-holders’ Equity is a measure of a company’s net worth, representing the residual interest of the owners (shareholders) in the assets of the company after deducting its liabilities. In simpler terms
ROE is very important for various reasons:
- It is a Profitability Indicator; ROE is a key measure of profitability, indicating how efficiently a company is using the money invested by shareholders to generate earnings.
- ROE is critical in assessing how well a company’s management is using its resources and investments to generate profits.
- Investors often use ROE to assess whether a company is a worthwhile investment. Higher ROE values generally appeal to investors looking for companies with strong profit-generating capabilities.
- ROE helps compare the profitability of different companies within the same industry, providing insights into which companies are managing their equity more effectively.
It’s self-evident that investing in companies with a higher Return on Equity (ROE) is always a good idea, as you are putting your money on a company with a good financial performance and an efficient management.
Return on Equity (ROE) definition:
ROE is a financial ratio that measures a company’s ability to generate profits from its shareholders’ equity.
Calculation Formula:
ROE=(Net Income/ Shareholders’ Equity)×100%
ROE gauges efficiency in generating earnings from shareholder investments.
ROE assesses management efficiency in resource and investment utilization.
Higher ROE attracts investors seeking strong profit-generating capabilities.
ROE aids industry comparisons, revealing effective equity management.
Criterion 4: Return on Investment (ROI)
The Return on Investment (ROI) of a company is a financial metric used to evaluate the efficiency of a company’s investment or to compare the efficiency of a number of different investments within the company. It is essentially a measure of the profitability and performance of the company, calculated as a percentage.
ROI for a company is calculated using the formula:
ROI=(Net Profit/Total Investment)×100%
Where:
- Net Profit is the gain obtained from the investment. This could be the overall profit of the company or the profit from a specific investment or project within the company.
- Total Investment refers to the total amount of resources invested in the company or in a specific project or asset.
The importance of ROI in a Company is driven by the following reasons:
- ROI is a Performance Measure: ROI is used to measure how effectively a company is using its capital to generate profits.
- ROI is used for Decision Making: It helps in making decisions about where to allocate resources within the company for the best returns.
- ROI allows for the comparison of returns from different investments or business units within the company, helping to identify which areas are performing well and which are not.
- ROI is used to evaluate Projects: ROI is particularly useful for assessing the profitability of different projects or initiatives the company undertakes, aiding in strategic planning and budget allocation.
The ROI of a company provides insights into the overall profitability and efficiency of its investments, guiding both operational and strategic decisions.
In conclusion, focusing on stocks of companies with a higher ROI stands as a sound strategic approach, offering the potential for robust returns and signaling a wise allocation of capital in the pursuit of long-term investment success.
Return on Investment (ROI) definition:
ROI gauges investment efficiency, crucial for company evaluation and comparing different investments
Calculation Formula:
ROI=(Net Profit/Total Investment)×100%
ROI gauges capital efficiency in profit generation.
Guides resource allocation for optimal returns.
Facilitates investment comparison and performance evaluation.
Valuable for assessing project profitability and strategic planning.
Criterion 5: EPS Surprise
EPS, or Earnings Per Share, is a financial metric that measures a company’s profitability distributed on each outstanding share of common stock. It’s calculated using the formula:
EPS=Net Income−Dividends on Preferred Stock/Total Outstanding Shares
In this formula:
- Net Income is the company’s total earnings or profit.
- Dividends on Preferred Stock are the dividends that must be paid to preferred shareholders.
- Total Outstanding Shares are the number of shares currently held by all shareholders.
In our CLAU trading strategy, we specifically target companies whose most recent earnings reports have positively surprised analysts with higher-than-expected EPS (Earnings Per Share) figures. For us, such a positive earnings surprise serves as a bullish signal. This is based on the premise that when a company’s actual earnings outperform the estimates set by financial analysts, it not only reflects the company’s robust financial health but also often leads to a favorable reaction in the market. This outperformance suggests that the company is performing better than the market anticipated, which can indicate underlying strengths in its operations, management efficiency, or market position. By focusing on these companies, our strategy aims to capitalize on the potential for stock price appreciation driven by positive market sentiment and revised future expectations. This approach is integral to identifying stocks that are not only showing strong current performance but also have the potential for continued success and growth.
Earnings Per Share (EPS) definition:
EPS is financial metric that measures a company’s profitability distributed on each outstanding share of common stock.
Calculation Formula:
EPS=Net Income−Dividends on Preferred Stock/Total Outstanding Shares
CLAU strategy targets companies with positive earnings surprises.
Positive surprises are viewed as bullish signals for stock price appreciation.
Outperformance reflects robust financial health and market reactions.
Focus is on stocks with strong current performance and potential for continued growth.
Criterion 6: EPS Growth Forecast
EPS growth forecast, or Earnings Per Share growth forecast, is a projection of how a company’s earnings per share is expected to change over a specific period, typically in the future. It’s a crucial factor in the valuation of a company for several reasons:
- Future Profitability: EPS growth forecasts provide insight into a company’s expected future profitability. Higher growth forecasts imply that the company is expected to become more profitable in the coming years, which is often seen as a positive sign for investors.
- Investor Expectations: Stock prices are influenced by investor expectations. If a company is expected to grow its EPS significantly, it may attract more investors, leading to an increase in its stock price.
- Competitive Position: Comparing a company’s EPS growth forecast to that of its competitors can reveal its competitive position within the industry. A higher growth forecast can indicate that the company is expected to outperform its peers.
- Valuation Metrics: EPS growth forecasts are used in various valuation models, such as the Price-to-Earnings (P/E) ratio and the Price-to-Earnings-to-Growth (PEG) ratio. These models help investors determine if a stock is undervalued or overvalued based on its growth prospects.
- Risk Assessment: The reliability of EPS growth forecasts can also help investors assess risk. If a company consistently meets or exceeds its growth projections, it may be considered less risky than a company that frequently falls short of expectations.
Our CLAU trading strategy prioritizes the selection of companies with a forecasted EPS growth that meets a specific threshold. This approach ensures that we focus on businesses not only demonstrating current profitability but also exhibiting potential for sustainable financial growth. By setting this EPS growth threshold as a key criterion, we strategically position our portfolio to capitalize on companies poised for upward trajectories, aligning with our overarching goal of long-term value creation and robust return on investments.
Furthermore, it is crucial for our CLAU trading strategy that the forecasted EPS growth also remains below a certain threshold. This is because exceedingly high growth rates, in percentage terms, can sometimes indicate that the company’s current EPS is exceptionally low. Such scenarios often raise concerns about the company’s historical performance and consistency. A very low EPS can suggest that the company does not have a proven track record of stable growth, which could imply higher risks and potential volatility. Our strategy, therefore, focuses on identifying companies that demonstrate not just the potential for growth, but also a history of steady and reliable financial performance. By setting both upper and lower limits on EPS growth forecasts, we aim to balance ambition with prudence, ensuring that our investments are both forward-looking and grounded in a solid history of success. This balanced approach allows us to select companies that are likely to provide sustainable growth and reliable returns, aligning with our commitment to long-term investment stability and profitability.
CLAU PERFORMANCE
What are the returns of the strategy? The numbers from CLAU speak for themselves.
We are proud to celebrate a remarkable journey. A journey filled with incredible achievements, bold decisions, and relentless commitment to financial excellence.
This journey is none other than the extraordinary performance of CLAU over the past decade.
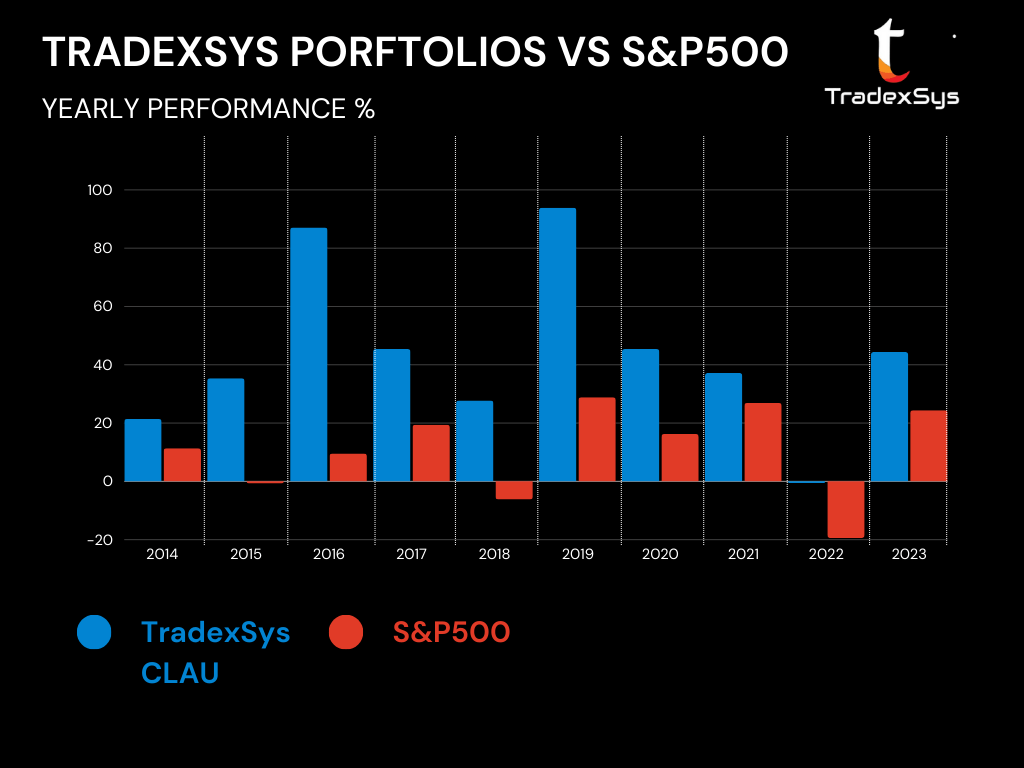
CLAU Performance Year by Year
In the last ten years, CLAU has delivered an annual average return of a staggering 43.7 %. To put this into perspective, the annual average return of the S&P 500, the benchmark of benchmarks, was 11.03%.
CLAU 10 YEARS
+437.3%
S&P 500 10 YEARS
+110.3%
CLAU Performance 10 years Average Return
The average return over last ten years demonstrates CLAU’s consistent outperformance, it is a testament to its unwavering dedication to delivering results.
CLAU 10 YEARS AVERAGE RETURN
+43.73%
S&P 500 10 YEARS AVERAGE RETURN
+11.03%
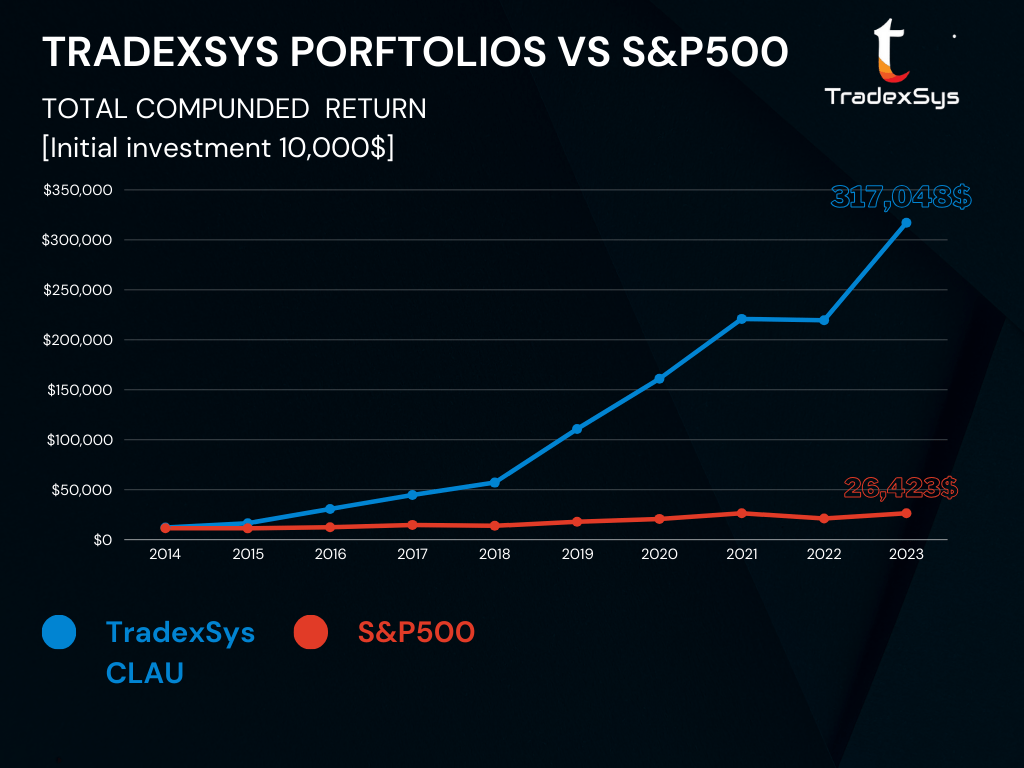
CLAU Performance Total Compounded Return
Now, here’s the real kicker: the total compounded return of CLAU since its inception in 2014 is a jaw-dropping 3,170.48%.
Imagine this: if you had invested $10,000 on January 1st, 2014, you would be sitting on $317,048 today. That’s the power of CLAU.
CLAU TOTAL COMPOUNDED RETURN
+3,170%
S&P 500 TOTAL COMPOUNDED RETURN
+264%

If you had invested 10.000$ in 2014 today, you would have 317,048$
CLAU Performance Key Factors
What truly sets CLAU apart is its remarkable track record against the S&P 500. Over the last decade, CLAU beat the S&P 500 a perfect ten out of ten times. Not a single year slipped by where CLAU didn’t outshine the benchmark.
While the S&P 500 faced its fair share of turbulent years, CLAU stood strong.
Consistency has been the hallmark of CLAU’s performance. Aside from 2022, CLAU closed every single year in the last decade with gains of 20% or higher. Not just that, it achieved returns exceeding 35% a remarkable seven times out of ten. Twice in this remarkable journey, CLAU’s performance soared to greater heights, with returns surpassing 85%.

Over the last decade, CLAU beat the S&P 500 a perfect ten out of ten times.

While the S&P 500 faced its fair share of turbulent years, CLAU stood strong. 2020 and 2022 performances are a testament to the consistency and strength of CLAU

Aside from 2022, CLAU closed every single year in the last decade with gains of 20% or higher. It achieved returns exceeding 35% a remarkable seven times out of ten. Twice CLAU’s performance had returns surpassing 85%.
CLAU Performance Resilience Amid Challenges
While the S&P 500 faced its fair share of turbulent years, CLAU stood strong. In 2022, a year often considered one of the toughest for financial markets in recent memory, CLAU displayed incredible resilience. While the S&P 500 tumbled by a significant 19.44%, CLAU closed the year only slightly negative, a mere 0.6%. And let’s talk about drawdowns – while the S&P 500 experienced a maximum drawdown of 23.9%, CLAU’s drawdown was notably lower at 18.1%. This year was a testament to the consistency and strength of CLAU.
We must also mention the challenging year of 2020, marked by the onset of the COVID-19 pandemic. During this period, CLAU experienced its maximum drawdown of 41.5%. But here’s the astonishing part – despite this turbulence, the year 2020 concluded with an extraordinary performance of 45.4%, nearly tripling the returns of the S&P 500.
2020
Even if Max drawdown was higher compared to S&P500, CLAU closed 2020 with a 45.4% return, nearly tripling the S&P 500 in a singular year.
2022
Max drawdown at 18.1%, outperforming the S&P 500’s 23.9%, and significantly overcame S&P 500 decline of 19.44%.
CLAU demonstrated consistency and strength during challenging market conditions
CLAU in Conclusion
In conclusion, CLAU’s journey over the last decade is a story of excellence, resilience, and exceptional returns. It’s an invitation to join us on this incredible path to financial success, where every year is a winning year, and every challenge is an opportunity. The numbers speak for themselves, and the door to this remarkable journey is wide open for those ready to embark on it.
Thank you for considering CLAU, where excellence is not an option; it’s the norm.
CLAU’s decade: excellence, resilience, exceptional returns.
Every year a win, every challenge an opportunity.
Join the open door to financial success.