
HOW TO BUY AND USE
FATAS PORTFOLIO DETAILS
FATAS January 2024 Result
FATAS OVERVIEW
Fatas is a meticulously crafted strategy born from the fusion of Fundamental and Technical Analysis. This innovative approach has delivered exceptional results, boasting a decade-long track record of an average annual return of 43.67%, far surpassing the S&P 500’s 11.03%.
Fatas it’s not just effective, but also revolutionary.
Backtested with outstanding results, Fatas is a strong example of profitable trading methodologies.
FATAS: AVERAGE ANNUAL RETURN
+43.67%
S&P 500: AVERAGE ANNUAL RETURN
+11.03%
Key Features of FATAS
What are the key features of FATAS? Let’s see them together:
- FATAS is Tailored for the Discerning Investor: Fatas is the perfect match for traders who harmonize the art of Fundamental and Technical Analysis in their investment decisions.
- FATAS adopts a dynamic, momentum-driven investment strategy, meticulously crafting a portfolio that includes seven distinct companies. It’s the STRATEGIC ASSET ALLOCATION of FATAS.
- FATAS adopts a Dynamic Portfolio Rebalancing to ensure optimal performance.
FATAS Selection Criteria
FATAS distinguishes itself with five meticulously crafted parameters:
- The first key parameter is given by Analyst Ratings: We focus on companies with an average analyst rating of 2 or lower, indicating strong buying potential.
- The second parameter is P/S Ratio: Our picks are companies with top P/S ratios within their sectors and industries.
- The third is the EPS Growth Forecast r: We target companies outperforming their competitors in earnings growth.
- The fourth parameter of the strategy concerns the Volume of the stocks traded: FATAS favors stocks with not only a consistent trading volume but also an upward trend in recent weeks.
- Finally, the last criteria of the strategy is the Upward trend in stock’s price.We select stocks exhibiting positive trends across long, medium, and short-term horizons surfing the so called Favorable Momentum
A Decade of Dominance
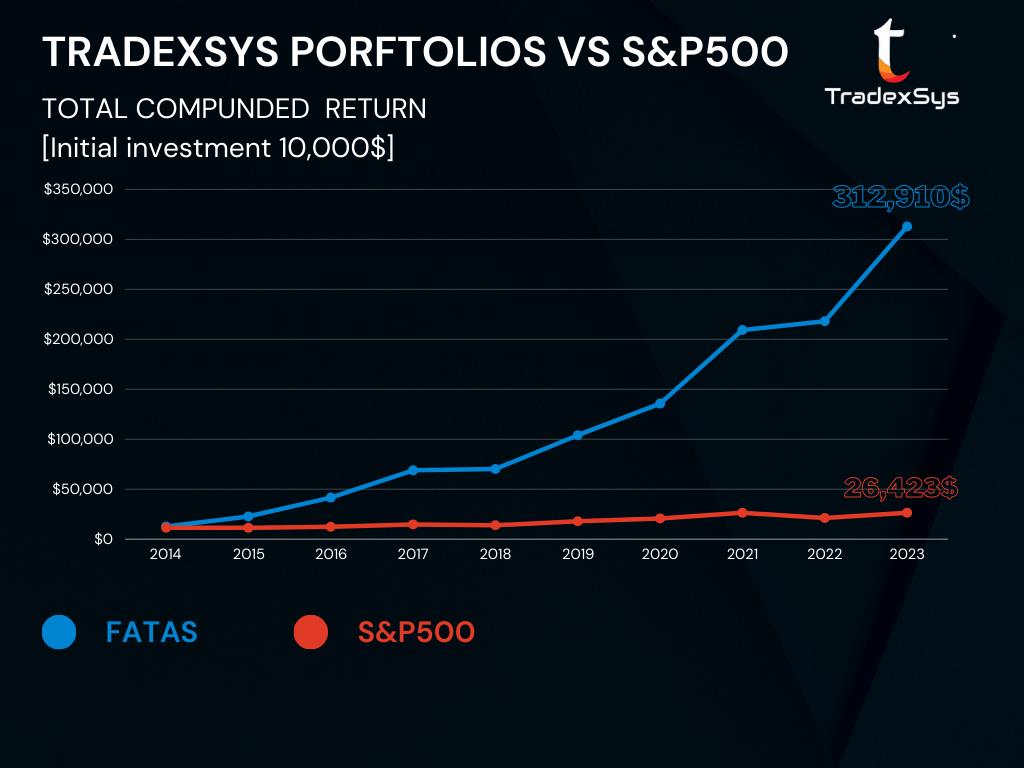
The proof, as they say, is in the pudding. Over the last decade, FATAS has delivered an average annual return of a staggering 43.67%, dwarfing the S&P 500’s 11.03%. The total compounded return of the strategy stands at an astonishing 3,129%.
Imagine transforming a $10,000 investment in 2014 into over $312,910 today – that’s the power of FATAS. Outperforming the S&P 500 year after year, for a decade, FATAS isn’t just a strategy; it’s a legacy of success.

FATAS KEY FEATURES
Investor Profile
In a few words, FATAS is tailored for the Discerning Investor. Fatas is the perfect match for traders who harmonize the art of Fundamental and Technical Analysis in their investment decisions.
Fundamental Analysis shows the intrinsic value of a company and its growth outlook.
Technical analysis of a stock involves examining historical market data, primarily price and volume, to predict future price movements. Technical analysis basically shows the price trend of a stock and how the market is perceiving the company’s fundamentals.
Neither fundamental analysis nor technical analysis is infallible, but their combination often gives us the correct overview of the company as a whole and, most importantly, its potential. Fatas is designed for high-risk investors who give both techniques the respect they deserve and have an appetite for substantial returns.
TECHNICAL ANALYSIS
+
FUNDAMENTAL ANALYSIS
Asset Allocation
Fatas adopts a dynamic, momentum-driven investment strategy, meticulously crafting a portfolio that includes seven distinct companies. This unique approach is not merely focused on current market trends, but rather on a deeper, more comprehensive analysis. Each company within the Fatas portfolio is selected through a rigorous process that blends strict fundamental analysis with an assessment of strong, positive price momentum.
Firstly, the fundamental parameters involve a thorough examination of each company’s financial health, including aspects such as earnings growth, revenue stability, profitability ratios, and balance sheet strength. This ensures that the companies chosen are not just currently performing well but have solid financial foundations to sustain future growth.
Secondly, we layer this fundamental analysis with an evaluation of positive price momentum. This means we’re looking for stocks that are not only fundamentally strong but are also experiencing an upward trajectory in their market prices. By focusing on price momentum, we aim to capitalize on market trends, identifying stocks that are gaining attention and value in the market, and are likely to continue their upward climb.
This combination of stringent fundamental analysis with positive price momentum allows Fatas to create a portfolio that is resilient, growth-oriented, and aligned with market dynamics. It’s a strategy designed to capture the upside of rapidly growing companies while being anchored by the robustness of their fundamental financial health.
In essence, Fatas’ portfolio is designed to harness the vigor of market trends while being grounded in financial reality, offering a balanced yet progressive investment opportunity.
FATAS
Dynamic
Investment
Momentum
Driven
Fundamental
Parameters
Stocks Turnover
Fatas undergoes a weekly portfolio turnover. A disciplined rebalancing of a portfolio is a strategic approach in investment management that involves periodically adjusting the assets in a portfolio to maintain a desired level of asset allocation or risk.
This process is crucial for aligning the portfolio with our investment strategy’s goals. This disciplined rebalancing is designed to ensure that the portfolio stays aligned with the long-term investment strategy’s targets , rather than deviating due to short-term market movements.
Moreover, the periodic turnover ensures that our portfolio consistently aligns with Fatas’ strategic parameters.
The disciplined rebalancing is not about timing the market but rather about maintaining a consistent approach to managing investment risk and aligning the portfolio with the strategy’s objectives. Over the past three years, Fatas has demonstrated a 65% turnover rate, signifying a vibrant and responsive strategy aimed to enhance overall portfolio returns.
Weekly Turnover
Strategic Rebalancing
Alignment with Long-Term Strategy
Consistent approach to manage the risk
65% turnover rate
Risk Management
FATAS adopts a Dynamic Portfolio Rebalancing to ensure optimal performance.
Disciplined rebalancing manages overall portfolio risk and helps maintain a long-term investment strategy, therefore, in a well-balanced and regularly rebalanced portfolio, the need for stop-loss orders may be reduced.
Particularly, Fatas counts on a weekly high turnover that makes the use of stop loss counterproductive in terms of risk management and performance. In Fatas, we replace a company when it does not meet the strategy parameters, but we ignore the short-terms price fluctuations. This strictly disciplined approach, allowed Fatas to generate astonishing returns without the use of stop loss.
Dynamic Portfolio Rebalancing
Disciplined Rebalancing
Proactive Portfolio Adjustments
No Stop Loss orders
Risk Managed
Long-term View
FATAS STOCKS SELECTION CRITERIA
Fatas distinguishes itself with five meticulously crafted parameters.
Criterion 1: Analyst Ratings
We focus on companies with an average analyst rating of 2 or lower, indicating strong buying potential. When a stock has an average analyst rating of “Buy” or “Strong Buy,” it reflects the consensus opinion of financial analysts covering that particular stock. Analysts from various financial institutions and research firms provide ratings on stocks based on their research and analysis.
The average rating is calculated by combining these individual ratings and determining the overall consensus. If most analysts give a stock a “Buy” or “Strong Buy” rating, the average rating reflects this positive sentiment. Analysts spend considerable time researching companies, including their financials, industry position, market trends, and future prospects. Their ratings are based on in-depth knowledge and analysis, therefore these ratings can serve as a useful guide in making investment decisions.
Analyst ratings can influence market sentiment and investors’ behavior. A “Buy” or “Strong Buy” rating may attract more investors to the stock, potentially driving up its price. In conclusion, the Analysts Rating parameter is a very valuable tools for our strategy, because it ensures a positive outlook of the company by the experts covering the stock.
Rating <= 2
Strong buying potential
Criterion 2: P/S Ratio
The Price-to-Sales (P/S) ratio, also known as the Price/Sales ratio, is a financial metric used to evaluate a company’s stock price relative to its revenue or sales per share. It’s calculated by dividing the market capitalization (total market value of a company’s outstanding shares) by the company’s total revenue over a specific period, usually on a per-share basis.
The formula for the Price-to-Sales ratio is:
P/S Ratio=Market Capitalization / Total Revenue (Sales) per Share
It provides insight into how much investors are willing to pay for each dollar of a company’s sales. A lower P/S ratio might indicate that a company’s stock is undervalued, while a higher P/S ratio suggests that it may be overvalued.
However, It’s important to note that the interpretation of the P/S ratio can vary between industries and companies. Particularly, comparing Price-to-Sales (P/S) ratios between companies in the same sector or industry is generally considered more meaningful and useful than comparing P/S ratios across different sectors for several reasons. First of all for the different Industry Norms that can affect the levels of profitability and growth potential of the companies.
What might be a typical P/S ratio for one industry could be very different for another.
For example, technology companies often have higher P/S ratios because investors expect rapid growth, while utility companies may have lower P/S ratios because they are more stable but have slower growth.
Secondly, Companies in different sectors may have entirely different business models and revenue structures. Comparing the P/S ratio of a service-based company to that of a manufacturing company might not provide relevant insights because their sales processes, margins, and growth prospects are fundamentally different.
Another reason is the risk factor that each sector carries on. For example, a technology startup might be seen as riskier but with higher growth potential compared to a well-established utility company. Therefore, investors are willing to pay a higher P/S ratio for the tech startup.
Finally, Economic Cycles: Industries can be affected differently by economic cycles. During economic downturns, certain sectors may see a more significant drop in sales, affecting their P/S ratios. Comparing P/S ratios across different sectors may not account for these economic dynamics.
For all the above reasons, in Fatas our picks are companies with better P/S ratios within their sectors and industries. Buying a stock with a lower Price-to-Sales (P/S) ratio within its industry suggests that the company is generating more revenue for each dollar invested by shareholders compared to its industry peers, indicating strong sales efficiency and potential for higher profitability.
P/S > Sector
The P/S ratio provides insight into how much investors are willing to pay for each dollar of a company’s sales
Criterion 3: EPS Growth Forecast
The EPS growth forecast, or Earnings Per Share growth forecast, is a projection of how a company’s earnings per share is expected to change over a specific period, typically in the future. It’s a crucial factor in the valuation of a company for several reasons:
- Future Profitability: EPS growth forecasts provide insight into a company’s expected future profitability. Higher growth forecasts imply that the company is expected to become more profitable in the coming years, which is often seen as a positive sign for investors.
- Investor Expectations: Stock prices are influenced by investor expectations. If a company is expected to grow its EPS significantly, it may attract more investors, leading to an increase in its stock price.
- Competitive Position: Comparing a company’s EPS growth forecast to that of its competitors can reveal its competitive position within the industry. A higher growth forecast can indicate that the company is expected to outperform its peers.
- Valuation Metrics: EPS growth forecasts are used in various valuation models, such as the Price-to-Earnings (P/E) ratio and the Price-to-Earnings-to-Growth (PEG) ratio. These models help investors determine if a stock is undervalued or overvalued based on its growth prospects.
- Risk Assessment: The reliability of EPS growth forecasts can also help investors assess risk. If a company consistently meets or exceeds its growth projections, it may be considered less risky than a company that frequently falls short of expectations.
In FATAS, we target companies showing a proven track record of growth and outperforming their competitors in earnings growth forecast.
FATAS targets companies showing a proven track record of growth and outperforming their competitors in earnings growth forecast.
Criterion 4: Consistent and Increasing Volume
The volume of stocks traded is an important factor for investors when deciding whether to buy or not buy a stock for several reasons:
- Liquidity Assessment: the Volume is a key indicator of a stock’s liquidity. Highly liquid stocks have more trading activity, meaning there are more buyers and sellers in the market. This liquidity is vital because it ensures that you can easily buy or sell shares without significantly impacting the stock’s price. Conversely, low-volume stocks can be illiquid and may have wider bid-ask spreads, making it more challenging to execute trades without affecting prices.
- Price Stability: Stocks with higher trading volumes tend to have more stable prices. When there’s a substantial trading volume, it’s less likely that a single large buy or sell order will cause significant price fluctuations. In contrast, low-volume stocks are more susceptible to price manipulation and extreme price swings due to relatively small trades.
- Narrower Bid-Ask Spreads: Stocks with higher trading volumes usually have narrower bid-ask spreads. The bid-ask spread is the difference between the highest price a buyer is willing to pay (the bid) and the lowest price a seller is willing to accept (the ask). Narrow spreads can reduce transaction costs, making it more cost-effective for investors to enter and exit positions.
- Market Sentiment: Trading volume can reflect market sentiment. A surge in volume can indicate increased interest and activity in a stock, often driven by news, earnings reports, or other significant events. Analyzing volume patterns can help investors gauge whether others in the market are bullish or bearish on the stock.
- Confirmation of Trends: Volume can provide confirmation of price trends. For example, if a stock is experiencing an uptrend with increasing volume, it suggests strong buying interest, reinforcing the bullish trend. Conversely, decreasing volume during an uptrend may signal weakening buyer enthusiasm, potentially indicating a trend reversal.
In summary, trading volume is a critical metric for investors to consider when making decisions about buying or selling stocks. It provides insights into liquidity, price stability, market sentiment, and risk. For all the above reasons, In Fatas we focus on stocks with Consistent and Growing Trading Volume. Particularly, the strategy favor stocks that overcome a minimum dollar volume threshold daily and show an upward trend in recent weeks.
FATAS focus on stocks with Consistent and Growing Trading Volume. Particularly, the strategy favor stocks that overcome a minimum dollar volume threshold daily and show an upward trend in recent weeks.
Criterion 5: Upward Trend in Stock’s Price
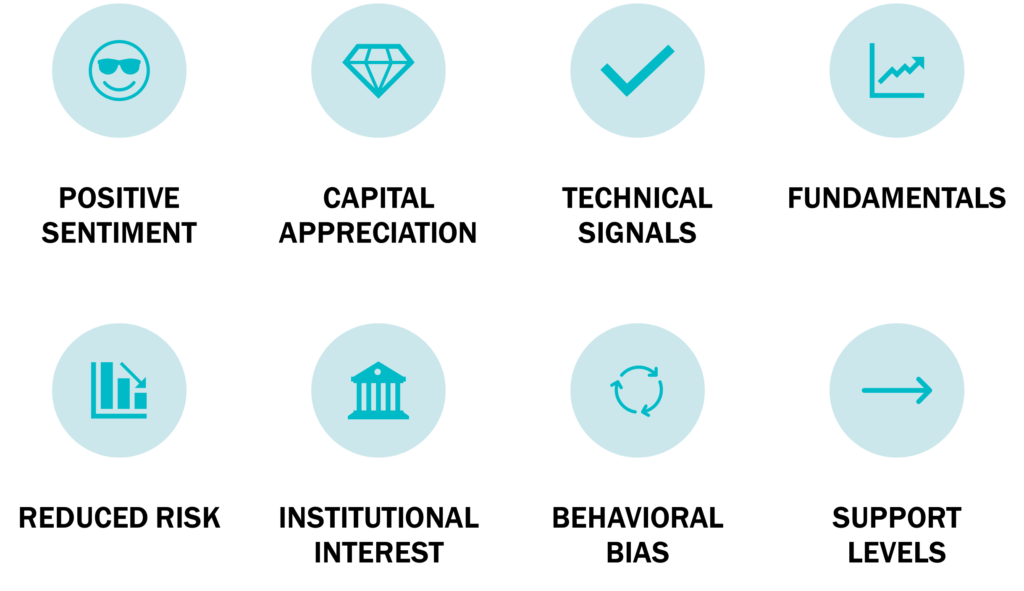
A favorable momentum, specifically an upward trend in the price of a stock, is considered a positive signal for bullish sentiment and potential investment for several reasons:
- Positive Market Sentiment: A rising stock price often reflects positive market sentiment and optimism about the company’s prospects. Investors and traders are generally more inclined to buy stocks that have been consistently trending upward because it indicates that others in the market are also buying, which can create a self-fulfilling prophecy.
- Potential for Capital Appreciation: When a stock is in an uptrend, investors anticipate that it will continue to rise in value. Buying a stock on an upward momentum can lead to capital appreciation, allowing investors to sell the stock later at a higher price and realize a profit.
- Technical Analysis Signals: Technical analysts often use chart patterns and technical indicators, so called Technical Analysis Signals, to identify trends and momentum in stock prices. Common technical indicators like moving averages, Relative Strength Index (RSI), and Moving Average Convergence Divergence (MACD) can signal bullish momentum when they exhibit certain patterns or values.
- Confirmation of Fundamentals: A stock’s price is influenced by its underlying fundamentals, such as revenue growth, earnings, and future prospects. When a stock price is rising, it may reflect improving or strong fundamentals, which can further bolster investor confidence.
- Reduced Risk of Loss: While no investment is entirely risk-free, stocks with upward momentum are perceived as having reduced downside risk compared to stocks in a downtrend. This is because an upward trend suggests that there is a stronger demand for the stock, which can provide a cushion against potential losses.
- Interest from Institutional Investors: A rising stock’s price may imply Interest from Institutional Investors, such as mutual funds, hedge funds, and pension funds, which often conduct in-depth research and analysis before making large investments. When they accumulate shares of a stock, it can be seen as a vote of confidence in the company, contributing to positive momentum.
- Behavioral Bias: An uptrend generate Behavioral biases, such as the “herd mentality,” and they can play a role in driving bullish momentum. When investors see others profiting from a stock, they may be more inclined to join the trend, fearing they will miss out on potential gains
- Support Levels: In an uptrend, stocks often establish higher support levels, where buying interest tends to emerge. Investors may see these support levels as potential entry points, further fueling the bullish momentum.
In conclusion, Fatas we give particular importance to all those factors that assert the Favorable Momentum of a stock. Therefore, the strategy focus only on stocks exhibiting positive trends across long, medium, and short-term horizons.
FATAS gives particular importance to all those factors that assert the Favorable Momentum of a stock. Therefore, the strategy focus only on stocks exhibiting positive trends across long, medium, and short-term horizons
FATAS PERFORMANCE
FATAS Performance Year by Year
FATAS has consistently outperformed the market, making waves in the world of finance. its results speak for themselves.
Since its inception in 2014, Fatas has achieved an incredible overall performance of 436.67%, while the S&P 500 index returned 110.3% over the same period. This means that the strategy’s returns exceeded the growth of the index by three and a half times.
FATAS 10 YEARS
+436.67%
S&P 500 10 YEARS
+110.03%
FATAS Performance 10 years Average Return
Over the last decade, Fatas boasted an annual average return of 43.67%, while the S&P 500 averaged just 11.03%. That’s an extraordinary difference in annual gains.
FATAS 10 YEARS AVERAGE RETURN
+43.67%
S&P 500 10 YEARS AVERAGE RETURN
+11.03%
FATAS Performance Total Compounded Return
What truly sets Fatas apart is its remarkable ability to compound wealth. If you had invested $10,000 in Fatas on January 1, 2014, your investment would have grown to a staggering $312,910 today. Yes, you heard that right 3129% in total compounded returns.
FATAS TOTAL COMPOUNDED RETURN
+3,129%
S&P 500 TOTAL COMPOUNDED RETURN
+264%
If you had invested 10.000$ in 2014 today, you would have 312.910$
FATAS Performance Key Factors

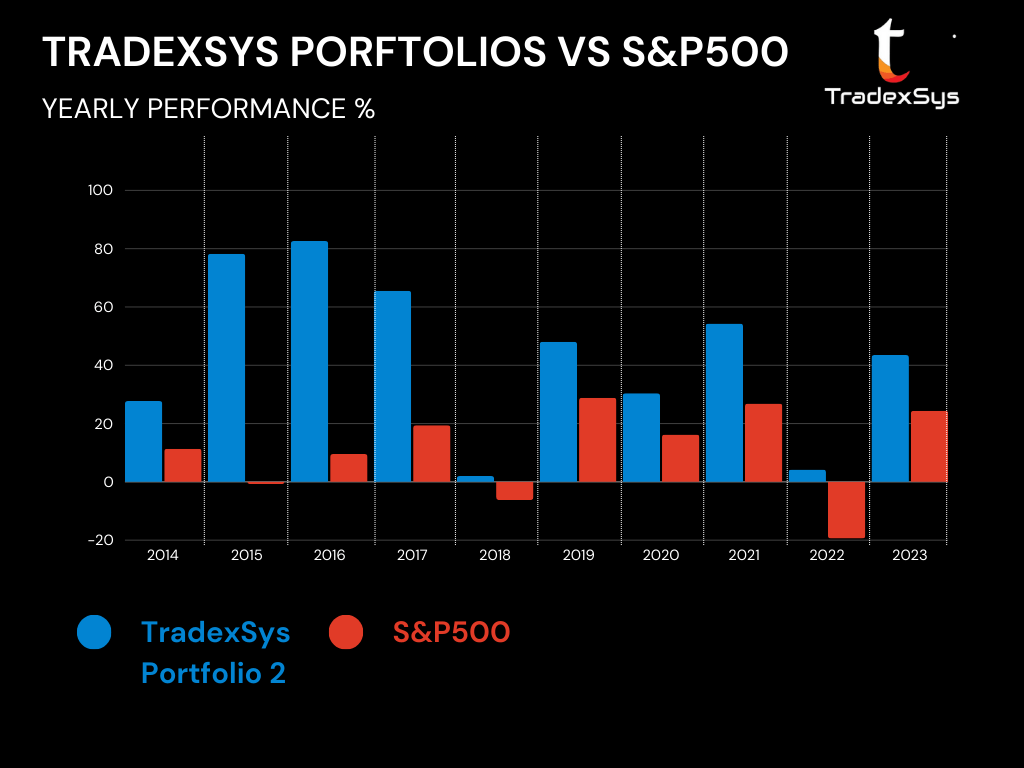
FATAS doesn’t just perform well; it consistently beats the S&P 500. In the last decade, it outperformed the index 10 times out of 10.

Unlike the S&P 500, which experienced three negative years in the last decade, FATAS remained in the green throughout. It’s a testament to the strategy’s resilience.

FATAS doesn’t just achieve strong returns; it delivers outstanding performance. In the past decade, it exceeded 25% returns on eight occasions, surpassed 50% four times, and even went beyond 75% twice.
FATAS Performance Resilience Amid Challenges
You might wonder if such incredible gains come with high risks.
Yes, there was a challenging period in the first quarter of 2020, with a maximum drawdown of 52.9%, driven by the unprecedented challenges posed by the Covid-19 pandemic. But here’s the astonishing part—despite this setback, Fatas managed to end the year 2020 with a remarkable 30.4% return, almost doubling the S&P 500’s performance, which stood at 16.26%.
In the midst of financial markets facing their most challenging year of the past decade, Fatas’s performance in 2022 truly shone. With a maximum drawdown of just 21.7%, better than the S&P 500’s 23.9%, and an impressive annual return of 4.4%, Fatas outperformed the S&P 500, which saw a significant decline of 19.44%. This remarkable resilience underscores Fatas’s ability to thrive even when the odds are stacked against the market.
2020
Even if Max drawdown was higher compared to S&P500, FATAS closed 2020 with a 30.4% return, doubling the S&P 500 in a singular year.
2022
Max drawdown at 21.7%, outperforming the S&P 500’s 23.9%, and achieved an impressive 4.4%, surpassing the S&P 500 decline of 19.44%.
FATAS demonstrated robust performance during challenging market conditions
FATAS in Conclusion
FATAS isn’t just a trading strategy; it’s a financial phenomenon.
Its performance is unparalleled, and the urgency to consider adopting this strategy couldn’t be clearer.
If you’re seeking exceptional returns and a strategy that consistently outpaces the market, FATAS is the answer. Don’t miss out on this incredible opportunity to potentially transform your financial future.
FATAS performance is unparalleled
FATAS uses best techniques of technical and fundamental analysis
FATAS consistently outpaces the market